

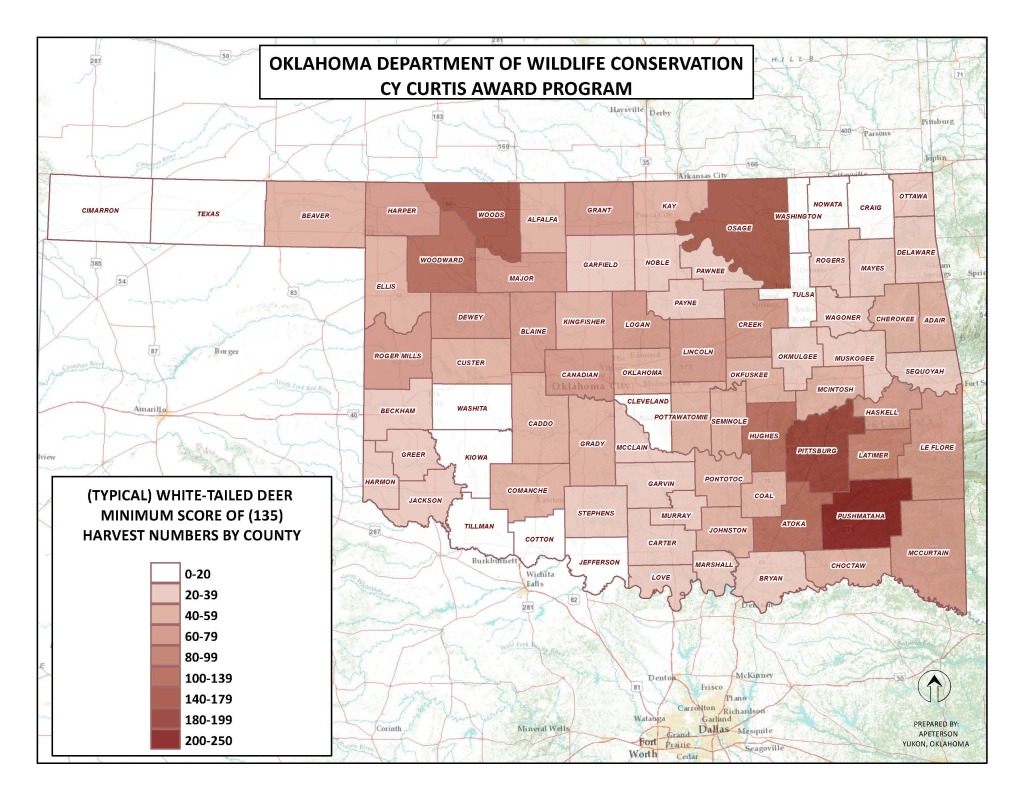
Seeing as I am employed as a Geospatial Analyst and was bored today I decided to leverage my talents and produce a few density maps that I think the OSA/Oklahoma Hunting Community will appreciate.
Step (1). I downloaded the most up to date (2010) Cy Curtis Award (Typical) & (Non-Typical) White-Tailed Deer Records from the ODWC Website.
Step (2). Categorized and sorted the Record data into County of Harvest, Method of Harvest and Date of Harvest.
Step (3). Created a pivot table in Excel and logged the number of Harvests per County up to the last recorded date (2010).
Step (4). Utilizing ArcGIS software I performed a simple Join function of the data to a Oklahoma County Dataset.
Step (5). Created a Map Layout for the data to be displayed.
Below is the final map products depicting the Oklahoma Counties with the highest density of Cy Curtis Award Typical and Non-Typical White-tailed Deer. This data may be useful to determine where your next lease or hunt should be. If you have any ideas or tips to improve these maps please feel free to contact me.
Enjoy,
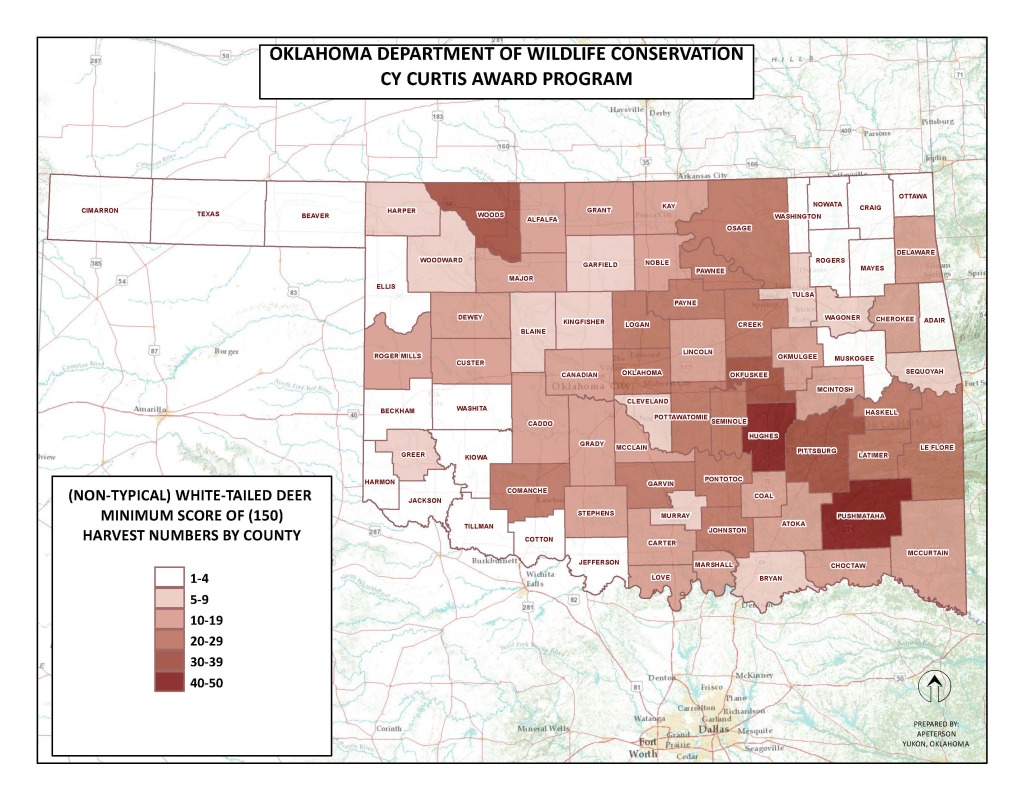
Last edited: