Tesla has received 325,000 preorders for the Model 3

This site may earn a commission from merchant affiliate links, including eBay, Amazon, and others.

_CY_

Sharpshooter
Supporting Member
Special Hen Supporter
Joined
May 11, 2009
Messages
33,848
Reaction score
6,620
Location
tulsa
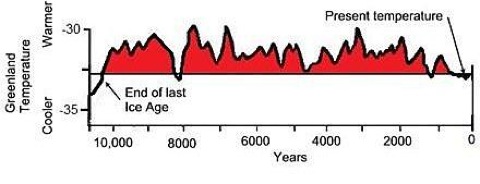
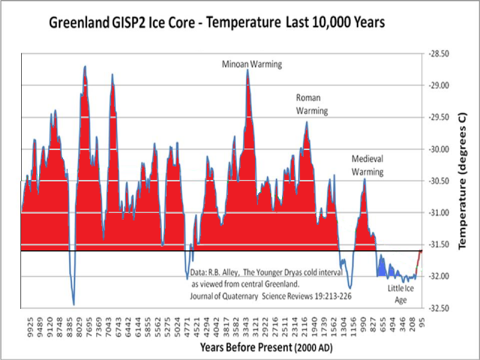
Oh, so now that I bring in actual scientific proxy data, instead of a cartoon, now suddenly proxy data are unreliable. So, a cartoon version of proxy data (which isn't based on any actual data) that supports your ideas is fine, actual proxy data, when it refutes your ideas, not so much.

BS .. your data looks like a cartoon too .. who says your data is correct anyway?
the only thing for sure is climate scientist cannot agree what is happening ... again ALL climate data over 150+ years old are ALL based upon interpolation of certain data points .. hell it could be CO2 contained in layers of ice or what ever. it's all speculation ..with NO one being able to say definitively this is what happened.

unless you were around say .. 20,000 years ago .. below cartoon is just someone's interpolation of data points that some scientists hope has some validity. anyone that says it's definitive is full of hucky puck!

www.ncdc.noaa.gov_paleo_abrupt_images_data4_climate_changes_lg.gif
 
Last edited:

doctorjj

Sharpshooter
Special Hen
Joined
Apr 16, 2009
Messages
7,041
Reaction score
1,178
Location
Pryor
BS .. your data looks like a cartoon too .. who says your data is correct anyway?
the only thing for sure is climate scientist cannot agree what is happening ... again ALL climate data over 150+ years old are ALL based upon interpolation of certain data points .. hell it could be CO2 contained in layers of ice or what ever. it's all speculation ..with NO one being able to say definitively this is what happened.

unless you were around say .. 20,000 years ago .. below cartoon is just someone's interpolation of data points that some scientists hope has some validity. anyone that says it's definitive is full of hucky puck!

www.ncdc.noaa.gov_paleo_abrupt_images_data4_climate_changes_lg.gif
So your cartoon isn't definitive either? Yours is hucky puck? Just want to make sure we are clear.
 

_CY_

Sharpshooter
Supporting Member
Special Hen Supporter
Joined
May 11, 2009
Messages
33,848
Reaction score
6,620
Location
tulsa
So your cartoon isn't definitive either? Yours is hucky puck? Just want to make sure we are clear.

never claimed mine was definitive or anything else .. or have you forgotten the request to back up what you posted?

I've repeated posted that no one really knows .. pretty sure that includes you too ...
 

_CY_

Sharpshooter
Supporting Member
Special Hen Supporter
Joined
May 11, 2009
Messages
33,848
Reaction score
6,620
Location
tulsa
let's drill in a bit shall we? "actual scientific proxy data"

the Greenland Ice Sheet Project looks to be based on interpolation of ice core data ..
first we have the official line from scientist working on said project who of course claim tracking of all sort of climatatic events from the coring samples. then we quickly find all sorts of skeptics who think otherwise ..

who is right and who is full of crap .. since I'm pretty sure none of these scientist were around back 10,000+ years ago. they really don't know .. they could be right or not?


GISP2 Home Page
www.gisp2.sr.unh.edu/
University of New Hampshire
With the completion of the GISP2 drilling program and a companion European ice coring effort, a new era in paleoenvironmental investigation has been opened.

GISP2 temperature data - Skeptical Science
https://www.skepticalscience.com/print.php?r=337
Skeptical Science
Figure 4 shows temperatures from the GISP2 Greenland ice core. With the exception of a brief warm period about 8,200 years ago, the entire period from 1,500 ...

GISP2 Ice Core Temperature and Accumulation Data
ftp://ftp.ncdc.noaa.gov/.../gisp2/.../gisp2_temp_accum_a...
National Climatic Data Center
GISP2 Ice Core Temperature and Accumulation Data. IGBP PAGES/World Data Center for Paleoclimatology Data Contribution Series #2004-013. NOAA/NGDC ...

=======

What The Science Says:
This argument uses temperatures from the top of the Greenland ice sheet. This data ends in 1855, long before modern global warming began. It also reflects regional Greenland warming, not global warming.

Climate Myth: Most of the last 10,000 years were warmer
Even if the warming were as big as the IPCC imagines, it would not be as dangerous as Mr. Brown suggests. After all, recent research suggests that some 9,100 of the past 10,500 years were warmer than the present by up to 3 Celsius degrees: yet here we all are. (Christopher Monckton)

This argument is based on the work of Don Easterbrook who relies on temperatures at the top of the Greenland ice sheet as a proxy for global temperatures. That’s a fatal flaw, before we even begin to examine the use of the ice core data. A single regional record cannot stand in for the global record — local variability will be higher than the global, plus we have evidence that Antarctic temperatures swing in the opposite direction to Arctic changes. Richard Alley discussed that in some detail at Dot Earth last year, and it’s well worth reading his comments. Easterbrook, however, is content to ignore someone who has worked in this field, and relies entirely on Greenland data to make his case.

Most of the past 10,000 [years] have been warmer than the present. Figure 4 shows temperatures from the GISP2 Greenland ice core. With the exception of a brief warm period about 8,200 years ago, the entire period from 1,500 to 10,500 years ago was significantly warmer than present.

This is Easterbrook’s Fig 4:

hot_topic.co.nz_wp_content_uploads_2011_01_easterbrook_fig41.jpg


It’s a graph he’s used before, in various forms, almost certainly copied and altered from the original (click image below to see source: the NOAA web page for Richard Alley’s 2000 paper The Younger Dryas cold interval as viewed from central Greenland, though DE credits it as “Modified from Cuffy and Clow, 1997″, misspelling Kurt Cuffey’s name in the process:


Easterbrook continues:

Another graph of temperatures from the Greenland ice core for the past 10,000 years is shown in Figure 5. It shows essentially the same temperatures as Cuffy and Clow (1997) but with somewhat greater detail. What both of these temperature curves show is that virtually all of the past 10,000 years has been warmer than the present.

This is his Fig 5:

hot_topic.co.nz_wp_content_uploads_2011_01_easterbrook_fig5.png


Easterbrook plots the temperature data from the GISP2 core, as archived here. Easterbrook defines “present” as the year 2000. However, the GISP2 “present” follows a common paleoclimate convention and is actually 1950. The first data point in the file is at 95 years BP. This would make 95 years BP 1855 — a full 155 years ago, long before any other global temperature record shows any modern warming. In order to make absolutely sure of my dates, I emailed Richard Alley, and he confirmed that the GISP2 “present” is 1950, and that the most recent temperature in the GISP2 series is therefore 1855.

This is Easterbrook’s main sleight of hand. He wants to present a regional proxy for temperature from 155 years ago as somehow indicative of present global temperatures. The depths of his misunderstanding are made clear in a response he gave to a request from the German EIKE forum to clarify why he was representing 1905 (wrongly, in two senses) as the present. Here’s what he had to say:

The contention that the ice core only reaches 1905 is a complete lie (not unusual for AGW people). The top of the core is accurately dated by annual dust layers at 1987. There has been no significant warming from 1987 to the present, so the top of the core is representative of the present day climate in Greenland.

Unfortunately for Don, the first data point in the temperature series he’s relying on is not from the “top of the core”, it’s from layers dated to 1855. The reason is straightforward enough — it takes decades for snow to consolidate into ice.

And so to an interesting question. What has happened to temperatures at the top of Greenland ice sheet since 1855? Jason Box is one of the most prominent scientists working on Greenland and he has a recent paper reconstructing Greenland temperatures for the period 1840-2007 (Box, Jason E., Lei Yang, David H. Bromwich, Le-Sheng Bai, 2009: Greenland Ice Sheet Surface Air Temperature Variability: 1840–2007. J. Climate, 22, 4029–4049. doi: 10.1175/2009JCLI2816.1). He was kind enough to supply me with a temperature reconstruction for the GRIP drilling site — 28 km from GISP2. This is what the annual average temperature record looks like (click for bigger version):


doctorjj

Sharpshooter
Special Hen
Joined
Apr 16, 2009
Messages
7,041
Reaction score
1,178
Location
Pryor
let's drill in a bit shall we? "actual scientific proxy data"

the Greenland Ice Sheet Project looks to be based on interpolation of ice core data ..
first we have the official line from scientist working on said project who of course claim tracking of all sort of climatatic events from the coring samples. then we quickly find all sorts of skeptics who think otherwise ..

who is right and who is full of crap .. since I'm pretty sure none of these scientist were around back 10,000+ years ago. they really don't know .. they could be right or not?


GISP2 Home Page
www.gisp2.sr.unh.edu/
University of New Hampshire
With the completion of the GISP2 drilling program and a companion European ice coring effort, a new era in paleoenvironmental investigation has been opened.

GISP2 temperature data - Skeptical Science
https://www.skepticalscience.com/print.php?r=337
Skeptical Science
Figure 4 shows temperatures from the GISP2 Greenland ice core. With the exception of a brief warm period about 8,200 years ago, the entire period from 1,500 ...

GISP2 Ice Core Temperature and Accumulation Data
ftp://ftp.ncdc.noaa.gov/.../gisp2/.../gisp2_temp_accum_a...
National Climatic Data Center
GISP2 Ice Core Temperature and Accumulation Data. IGBP PAGES/World Data Center for Paleoclimatology Data Contribution Series #2004-013. NOAA/NGDC ...

=======

What The Science Says:
This argument uses temperatures from the top of the Greenland ice sheet. This data ends in 1855, long before modern global warming began. It also reflects regional Greenland warming, not global warming.

Climate Myth: Most of the last 10,000 years were warmer
Even if the warming were as big as the IPCC imagines, it would not be as dangerous as Mr. Brown suggests. After all, recent research suggests that some 9,100 of the past 10,500 years were warmer than the present by up to 3 Celsius degrees: yet here we all are. (Christopher Monckton)

This argument is based on the work of Don Easterbrook who relies on temperatures at the top of the Greenland ice sheet as a proxy for global temperatures. That’s a fatal flaw, before we even begin to examine the use of the ice core data. A single regional record cannot stand in for the global record — local variability will be higher than the global, plus we have evidence that Antarctic temperatures swing in the opposite direction to Arctic changes. Richard Alley discussed that in some detail at Dot Earth last year, and it’s well worth reading his comments. Easterbrook, however, is content to ignore someone who has worked in this field, and relies entirely on Greenland data to make his case.

Most of the past 10,000 [years] have been warmer than the present. Figure 4 shows temperatures from the GISP2 Greenland ice core. With the exception of a brief warm period about 8,200 years ago, the entire period from 1,500 to 10,500 years ago was significantly warmer than present.

This is Easterbrook’s Fig 4:

hot_topic.co.nz_wp_content_uploads_2011_01_easterbrook_fig41.jpg


It’s a graph he’s used before, in various forms, almost certainly copied and altered from the original (click image below to see source: the NOAA web page for Richard Alley’s 2000 paper The Younger Dryas cold interval as viewed from central Greenland, though DE credits it as “Modified from Cuffy and Clow, 1997″, misspelling Kurt Cuffey’s name in the process:


Easterbrook continues:

Another graph of temperatures from the Greenland ice core for the past 10,000 years is shown in Figure 5. It shows essentially the same temperatures as Cuffy and Clow (1997) but with somewhat greater detail. What both of these temperature curves show is that virtually all of the past 10,000 years has been warmer than the present.

This is his Fig 5:

hot_topic.co.nz_wp_content_uploads_2011_01_easterbrook_fig5.png


Easterbrook plots the temperature data from the GISP2 core, as archived here. Easterbrook defines “present” as the year 2000. However, the GISP2 “present” follows a common paleoclimate convention and is actually 1950. The first data point in the file is at 95 years BP. This would make 95 years BP 1855 — a full 155 years ago, long before any other global temperature record shows any modern warming. In order to make absolutely sure of my dates, I emailed Richard Alley, and he confirmed that the GISP2 “present” is 1950, and that the most recent temperature in the GISP2 series is therefore 1855.

This is Easterbrook’s main sleight of hand. He wants to present a regional proxy for temperature from 155 years ago as somehow indicative of present global temperatures. The depths of his misunderstanding are made clear in a response he gave to a request from the German EIKE forum to clarify why he was representing 1905 (wrongly, in two senses) as the present. Here’s what he had to say:

The contention that the ice core only reaches 1905 is a complete lie (not unusual for AGW people). The top of the core is accurately dated by annual dust layers at 1987. There has been no significant warming from 1987 to the present, so the top of the core is representative of the present day climate in Greenland.

Unfortunately for Don, the first data point in the temperature series he’s relying on is not from the “top of the core”, it’s from layers dated to 1855. The reason is straightforward enough — it takes decades for snow to consolidate into ice.

And so to an interesting question. What has happened to temperatures at the top of Greenland ice sheet since 1855? Jason Box is one of the most prominent scientists working on Greenland and he has a recent paper reconstructing Greenland temperatures for the period 1840-2007 (Box, Jason E., Lei Yang, David H. Bromwich, Le-Sheng Bai, 2009: Greenland Ice Sheet Surface Air Temperature Variability: 1840–2007. J. Climate, 22, 4029–4049. doi: 10.1175/2009JCLI2816.1). He was kind enough to supply me with a temperature reconstruction for the GRIP drilling site — 28 km from GISP2. This is what the annual average temperature record looks like (click for bigger version):

You finally post some actual data but then post a rebuttal from Skeptical Science, which is a leftist, CAGW promoting site that is anything but Skeptical. You need to read the studies and make an informed opinion. Don't believe everything you see on the web. And back to the cartoon, if you agree that it's likely complete BS, then why post it to begin with?
 

_CY_

Sharpshooter
Supporting Member
Special Hen Supporter
Joined
May 11, 2009
Messages
33,848
Reaction score
6,620
Location
tulsa
You finally post some actual data but then post a rebuttal from Skeptical Science, which is a leftist, CAGW promoting site that is anything but Skeptical. You need to read the studies and make an informed opinion. Don't believe everything you see on the web. And back to the cartoon, if you agree that it's likely complete BS, then why post it to begin with?

I've never agreed long graph was complete BS ... more like YOU called it BS ... sooo I say prove it. all along I've maintained no one really knows and backed that up. vs you have not even come close to backing what you have posted.

I've got no problems diving in and getting technical as almost anyone in the world. but the problem is .. posting up too much technical details, generally will put most folks to zzzz.

it's much harder to explain a highly technical topic in a simple/easy to understand manner .. like above long cartoonish graph that started this ..
 
Last edited:

doctorjj

Sharpshooter
Special Hen
Joined
Apr 16, 2009
Messages
7,041
Reaction score
1,178
Location
Pryor
I've never agreed long graph was complete BS ... more like YOU called it BS ... sooo I say prove it. all along I've maintained no one really knows and backed that up. vs you have not even come close to backing what you have posted.

I've got no problems diving in and getting technical as almost anyone in the world. but the problem is .. posting up too much technical details, generally will put most folks to zzzz.

it's much harder to explain a highly technical topic in a simple/easy to understand manner .. like above long cartoonish graph that started this ..
You maintain no one knows but then post a graph/cartoon that purportes to know what happened for the past 20,000 years but then I have to prove that your cartoon is wrong?? That's now how it works.
 

_CY_

Sharpshooter
Supporting Member
Special Hen Supporter
Joined
May 11, 2009
Messages
33,848
Reaction score
6,620
Location
tulsa
You maintain no one knows but then post a graph/cartoon that purportes to know what happened for the past 20,000 years but then I have to prove that your cartoon is wrong?? That's now how it works.

BS .. posting a relevant graph has nothing to do with the fact that climate change is highly controversial in no small part to due scientist cannot all agree. vs you coming on by stating it's full of crap .. well ok .. prove it

back it up or not ...
 
Last edited:

doctorjj

Sharpshooter
Special Hen
Joined
Apr 16, 2009
Messages
7,041
Reaction score
1,178
Location
Pryor
BS .. posting a relevant graph has nothing to do with the fact that climate change is highly controversial in no small part to due scientist cannot all agree. vs you coming on by stating it's full of crap .. well ok .. prove it

back it up or not ...
Extraordinary claims require extraordinary evidence. You are admitting it's controversial, all the while everything you've said and posted has been from a warmist' perspective. By posting that graph, you are claiming that the recent warming is unprecedented. That is an extraordinary claim. If you aren't claiming that, then why post it at all?
 

_CY_

Sharpshooter
Supporting Member
Special Hen Supporter
Joined
May 11, 2009
Messages
33,848
Reaction score
6,620
Location
tulsa
Extraordinary claims require extraordinary evidence. You are admitting it's controversial, all the while everything you've said and posted has been from a warmist' perspective. By posting that graph, you are claiming that the recent warming is unprecedented. That is an extraordinary claim. If you aren't claiming that, then why post it at all?

BS .. why don't you quit side tracking and back up your earlier claims?
 

Latest posts

Top Bottom